Skip to end of metadata
Go to start of metadata
You are viewing an old version of this content. View the current version.
Compare with Current
View Version History
« Previous
Version 3
Next »
- See Editing a View for information on how to edit an existing chart view's properties.
- See Copying a View for information on how to copy a chart view.
- See Printing a View for information on how to print a chart view.
- See Opening Multiple Views for information on how to open a chart view in a new window.
- See Using Folders and Sharing Views for information on creating folders for your views and sharing them with other users.
- See Sorting Views and View Folders in a Service for information on creating and loading view templates.
- Charts appear on the Chart tab within the view display window.
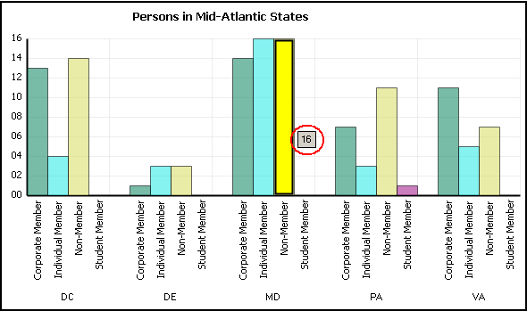
- If you specified a drill-down view for the chart view, click a bar, column, or section of a pie or doughnut chart to display a list view of the records and their related records that correspond to the selected item.
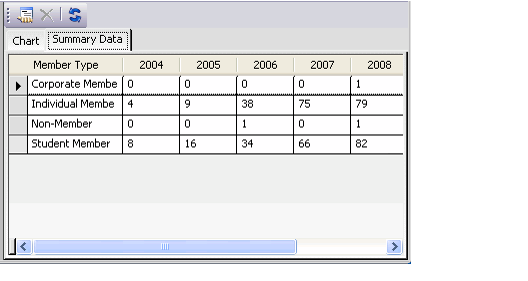
- If enabled, the Summary Data Table tab appears to the right of the Chart tab. The table displays the information that the system uses as the source data when rendering the chart.


- Within a chart, place your cursor over a bar, column, or section of a pie or doughnut chart to display the value for that particular item. For example, the number of people in the database who are in Maryland and who are non-members is 177.

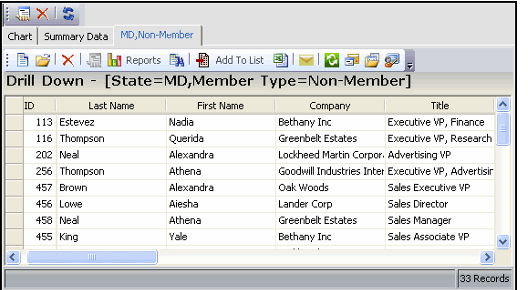
- Click a bar, column, or section of a pie or doughnut chart to drill down to a view of the records that correspond to the selected item. This can be any type of view, depending on the drill down view you specified. If you did not specify a drill down view, the system displays the results in the default list view format. The system adds a separate tab for each drill-down you add, as shown in the figure. You can use the Delete button on the Chart toolbar to close all open drill-down tabs.

- Each Chart View has a toolbar across the top of the view. From left to right, the buttons are as follows:

- View Properties: Open the view's Properties dialog.
- Delete: Click this button to delete open drill-down tabs. This button is only available when one or more drill-down tabs appear on the chart.
- Refresh: Click this button to manually refresh the view's contents.


