- See Editing a View for information on how to edit an existing chart view's properties.
- See Copying a View for information on how to copy a chart view.
- See Printing a View for information on how to print a chart view.
- See Opening Multiple Views for information on how to open a chart view in a new window.
- See Using Folders and Sharing Views for information on creating folders for your views and sharing them with other users.
- See Sorting Views and View Folders in a Service for information on creating and loading view templates.
- Charts appear on the Chart tab within the view display window.
- If you specified a drill-down view for the chart view, click a bar, column, or section of a pie or doughnut chart to display a list view of the records and their related records that correspond to the selected item.
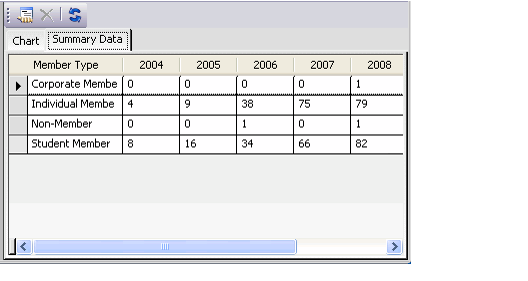
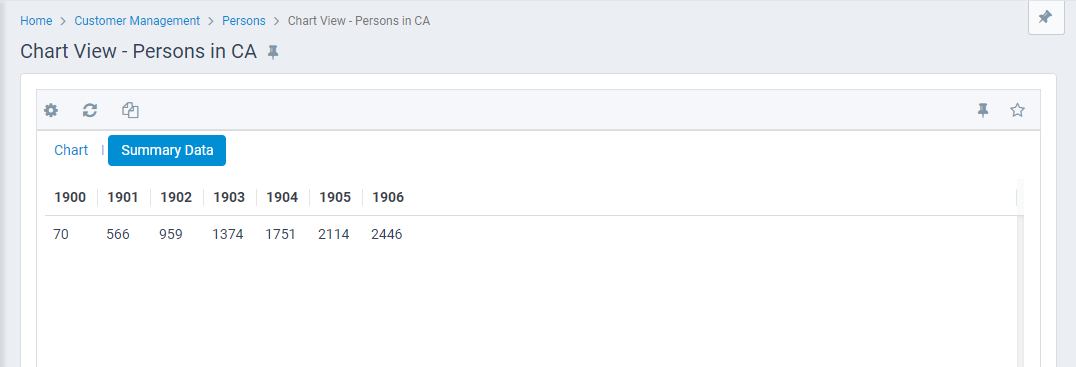
If enabled, the Summary Data Table tab appears to the right of the Chart tab. The table displays the information that the system uses as the source data when rendering the chart.
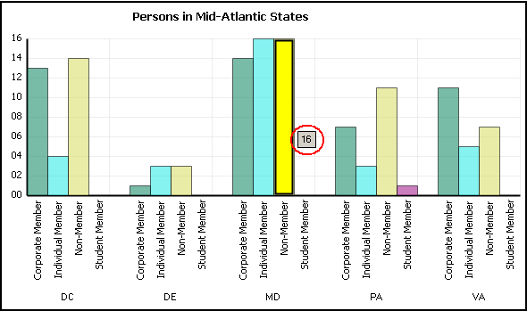
- Within a chart, place your cursor over a bar, column, or section of a pie or doughnut chart to display the value for that particular item. For example, the number of people in the database who are in Maryland and who are non-members is 177.
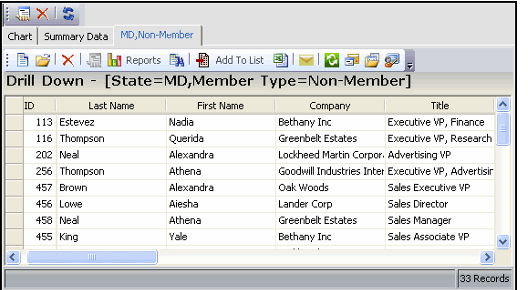
- Click a bar, column, or section of a pie or doughnut chart to drill down to a view of the records that correspond to the selected item. This can be any type of view, depending on the drill down view you specified. If you did not specify a drill down view, the system displays the results in the default list view format. The system adds a separate tab for each drill-down you add, as shown in the figure. You can use the Delete button on the Chart toolbar to close all open drill-down tabs.
- Each Chart View has a toolbar across the top of the view. From left to right, the buttons are as follows:
- View Properties: Open the view's Properties dialog.
- Delete: Click this button to delete open drill-down tabs. This button is only available when one or more drill-down tabs appear on the chart.
- Refresh: Click this button to manually refresh the view's contents.


