Recommendations for Debugging Code
This section provides two recommended approaches to debugging your code-based configurations for Aptify:
- Debugging Procedure 1: Use Breakpoints with External Program
- Debugging Procedure 2: Use Breakpoints with Attach to Process
- Debugging Procedure 3: Use Test Handles
The sample application's Sample Code folder includes a Debug folder with a PDB file for each sample code project. You can use this file in conjunction with the distributed assemblies to run the projects in debug mode. (In other words, you do not need to recompile a sample project first before running in debug mode.)
Debugging Procedure 1: Use Breakpoints with External Program
Assuming that the class is already uploaded into Aptify, follow these steps to debug your code using Visual Studio's Start External Program option to launch the Aptify application when you begin debugging:
- Set the Solution Configuration to Debug, if not already specified.
- Insert the breakpoint(s) where needed in your VB class.
- Build your VB Project.
- Copy the generated DLL and PDB files from the VB Project's Debug folder (typically, bin\debug) into your computer's Aptify program files directory (typically, C:\Program Files\Aptify 5.5).
- Upload the latest DLL into the Aptify Object Repository and close Aptify.
- See Administering the Object Repository for details. Updating a repository object is also described in Updating Crystal Reports Already Present in Aptify and Updating SSRS Reports Already Present in Aptify.
- See Administering the Object Repository for details. Updating a repository object is also described in Updating Crystal Reports Already Present in Aptify and Updating SSRS Reports Already Present in Aptify.
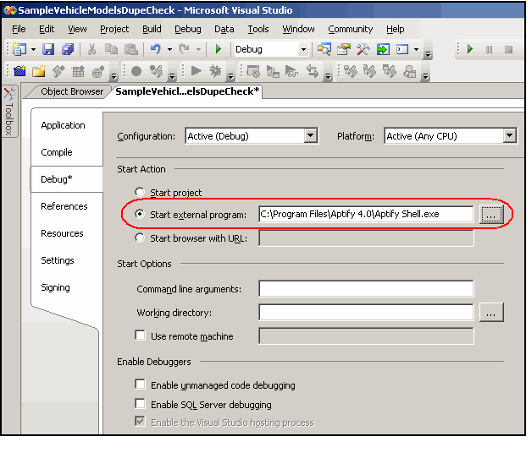
- Return to Visual Studio and open the Project Properties.
- Click the Debug tab.
- Browse or enter the path for the Aptify Shell.exe file in the Start external program field.
- Save the project.
- Click the Start Debugging button in Visual Studio.
- When the Aptify Login dialog appears, enter your test server and account information.
- Note that the dialog's Server and User fields will be blank, even if you have configured your server's Startup.exe.config file to pre-populate information, since you are running Aptify Shell.exe rather than Startup.exe and have bypassed the information in the Startup.exe.config file.
- Note that the dialog's Server and User fields will be blank, even if you have configured your server's Startup.exe.config file to pre-populate information, since you are running Aptify Shell.exe rather than Startup.exe and have bypassed the information in the Startup.exe.config file.
- Access the feature related to the DLL you are testing. You should hit the breakpoint accordingly when that line of code is going to be executed.
Debugging Procedure 2: Use Breakpoints with Attach to Process
This procedure is similar to Debugging Procedure 1: Use Breakpoints with External Program, except you attach to an existing process rather than open a new instance of Aptify.
Assuming that the class is already uploaded into Aptify, follow these steps to debug your code using the Attach to Process option:
- Set the Solution Configuration to Debug, if not already specified.
- Insert the breakpoint(s) where needed in your VB class.
- Build your VB Project.
- Copy the generated DLL and PDB files from the VB Project's Debug folder (typically, bin\debug) into your computer's Aptify program files directory (typically, C:\Program Files\Aptify 5.5).
- Upload the latest DLL into the Aptify Object Repository.
- See Administering the Object Repository for details. Updating a repository object is also described in Updating Crystal Reports Already Present in Aptify and Updating SSRS Reports Already Present in Aptify.
- See Administering the Object Repository for details. Updating a repository object is also described in Updating Crystal Reports Already Present in Aptify and Updating SSRS Reports Already Present in Aptify.
- Leave the Aptify application running and return to Visual Studio.
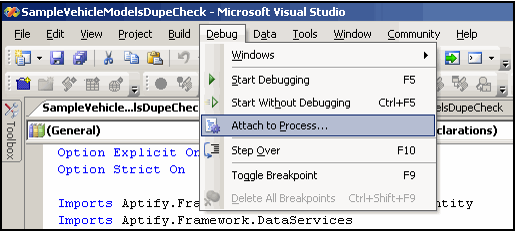
- Select the Debug > Attach to Process... menu item.
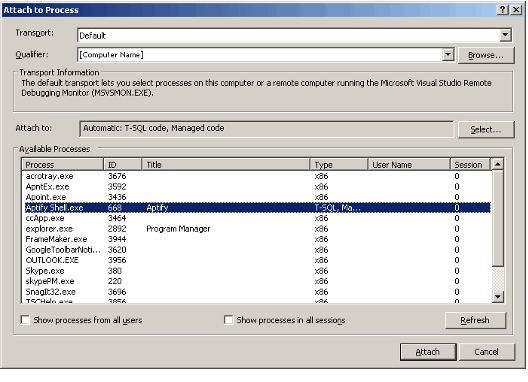
- Select the Aptify instance that is currently running and click Attach.
- Be sure to select the correct instance if you have more than instance of Aptify currently running.
- Be sure to select the correct instance if you have more than instance of Aptify currently running.
- After Visual Studio loads into debug mode, switch back to the Aptify application and access the feature related to the DLL you are testing. You should hit the breakpoint accordingly when that line of code is going to be executed.
Debugging Procedure 3: Use Test Handles
Follow these steps to use a test handle to assist with debugging code:
- Add a form or class with a main loop routine to your project.
- Write some code to call the desired functionality within your object.
- Change the project to a Windows Application and build.
- Enter breakpoints.
Keep in mind the following points related to this method:
- It has the advantage of retaining edit and continue, which is useful for rapid iterations in the early stages of development.
- It is usually best to compile your project as a DLL and integrate it into Aptify as a first task, just to make sure the object is being called properly.
- Always test thoroughly once updating the Object Repository (to determine if something stopped working since using the test handle for debugging).
- Aptify recommends that you remove the handle from the project once the code is production ready. It may confuse other developers or users not familiar with the method.
Related content
Copyright © 2014-2017 Aptify - Confidential and Proprietary


