/
Creating a Map View
Creating a Map View
The following steps describe how to create a map view:
Your computer must have Microsoft MapPoint 2006 installed to create or open map views in Aptify.
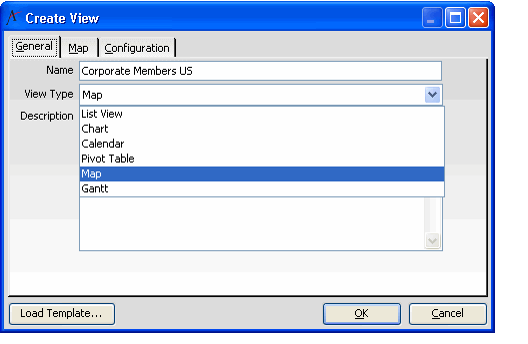
- Open a new view, enter a Name, and select Map from the View Type drop-down list.
- Notice that the tab layout is updated automatically: a new Map tab appears in the dialog and the other tabs are removed.
- If you want to use an existing template as the starting point for your view, click the Load Template... button. See Loading a View Template for details.
- Note that the Show Default Preview Pane option is only applicable to list views.
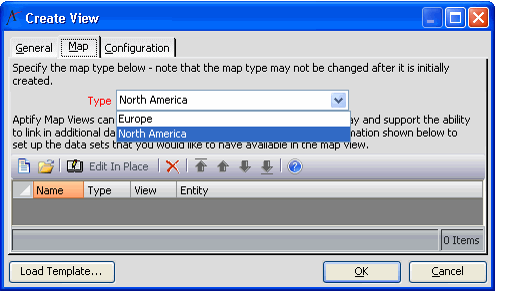
- Click the Map tab.
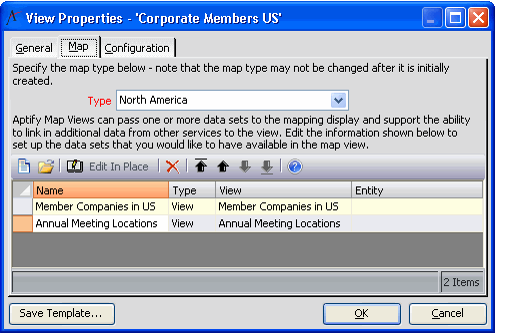
- Select the Type from the drop-down list. The options are North America and Europe.
- To create a map view of North America, you must have Microsoft MapPoint North America installed.
- To create a map view for Europe, you must have Microsoft MapPoint Europe installed.
- Click the New button in the toolbar to open a new Data Sets record.
- A map view can support multiple data sets from across services. Each data set is represented separately within the map view.
- For example, you can create a map view that plots member companies in the United States against the location of your organization's Annual Meeting for the last four years.
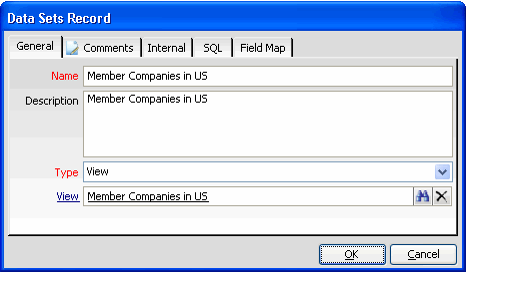
- Enter a Name and Description for the data set.
- Select the source Type for the data set. The options are View (an existing list view in Aptify) or SQL (you want to specify a SQL statement to define the data set yourself – this option is for advanced users).
- If you selected the View type, enter an existing list view that provides the data you want to plot on the map in the View link box.
- For best results, a data set should only pass in one set of addresses for a particular record to MapPoint. Therefore, the view you select should contain one set of address fields from the view's service.
- For example, if creating a Map View for Persons, the source view you specify should contain fields for only one address (such as a Business Address, a Billing Address, or a Home Address). This will be the address the map view uses to plot the record.
- See Specifying the Fields in a View for information on how to specify the fields that are included in a list view.
- For best results, a data set should only pass in one set of addresses for a particular record to MapPoint. Therefore, the view you select should contain one set of address fields from the view's service.
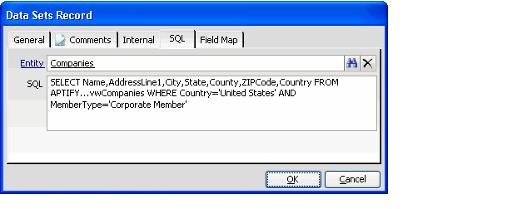
- If you selected the SQL type, leave the View link box blank on the General tab and click the SQL tab. Complete the following fields:
- Entity: The name of the service from which the SQL statement will pull data.
- SQL: The SQL statement that will provide the information for the map view's data set. When writing a SQL statement for a data set, keep in mind the following points:
- If the records in a service have more than one address (such as Persons or Companies), you must explicitly select the fields for a particular address in that service (such as the fields that correspond to the Business Address for a Company, as shown in the figure). If the service only has one address, you can use a SELECT * No reference of the statement.
- The SQL option is intended for advanced users. Contact your system administrator if you need assistance creating a map view that requires a SQL-based data set.
Click the Comments tab and add any notes concerning this data set.
Do not configure any settings on the Internal or Field Map tabs. The Field Map tab is reserved for future use. The Internal tab is used by the map view to record the amount of time it took this data set to load the last time the map view was opened.
Click OK to save and close the Data Sets record.
- Repeat the above steps to add additional Data Sets as desired.
- The example in the figure below includes two data sets: one for member companies and one for the organization's annual meeting over the last four years. In this example, both data sets are based on existing list views.
- The example in the figure below includes two data sets: one for member companies and one for the organization's annual meeting over the last four years. In this example, both data sets are based on existing list views.
- Click OK to load the map view.
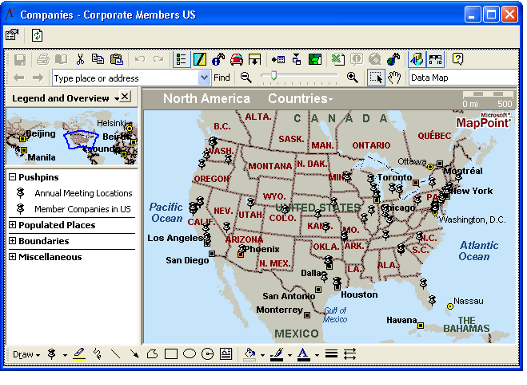
- Aptify automatically launches Microsoft MapPoint and plots the data sets on the map.
- If you specified multiple data sets, the results all use the clear pushpin. Once loaded, you can modify the pushpin's appearance for each data set so you can easily differentiate between the results. See Modifying Data Set Appearance for details.
, multiple selections available,
Related content
Using Map Views
Using Map Views
More like this
Configuring Map Views in the Aptify Web Interface
Configuring Map Views in the Aptify Web Interface
Read with this
Creating a Map View
Creating a Map View
More like this
Using Map Views
Using Map Views
More like this
Important Note Concerning MapPoint Features
Important Note Concerning MapPoint Features
More like this
Modifying Data Set Appearance
Modifying Data Set Appearance
More like this
Copyright © 2014-2019 Aptify - Confidential and Proprietary
